TL;DR
Overview
I was approached by the Director of Innovation to join the team on a 3 month assignment, helping them with product design and user research for a new prototype designed to streamline the TCFD reporting experience for small to mid-sized corporates who are customers of the exchange. The platform would streamline the reporting process which was tedious and fragmented, as well as provide intelligence on evolving regulations, and other sustainability data to help inform the reporting process and contribute to the wider discussion on sustainability strategy. By the time I’d joined the team, the discovery phase had already been completed and a design prototype of the platform and its visualisations had already been built - of which they needed validation in order to prioritize the key use cases to build for the next iteration.
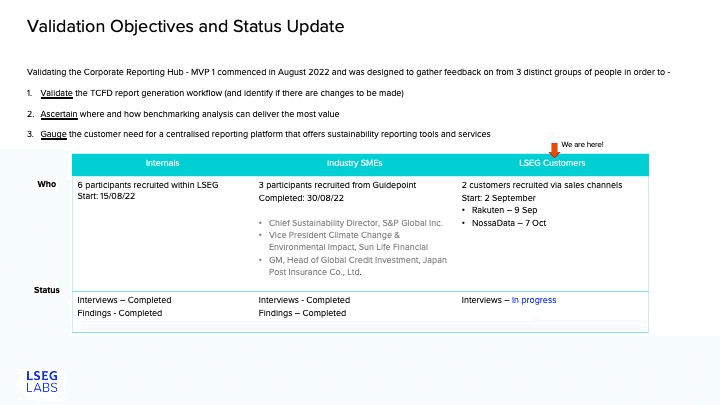
A lightweight research strategy and plan I formulated and presented to the team to ensure transparency and open communication for the short but targeted 3 month duration
The challenges of sustainability reporting
Small to mid-sized corporates face an uphill climb when creating sustainability reports, specifically TCFD (Task Force on Climate Financial Disclosures) or TPI (Transition Pathway Initiative) reports. Oftentimes, these corporates have a small team or an individual, tasked with creating these reports to fold into the annual reporting cycle, on top of their day job. This is coupled with complex and constantly evolving regulations on climate reporting, conflicting methodologies, measurements and no standard process for gathering and reporting on information. It is an overwhelming, all-consuming task, of which the collection of datapoints is tedious. To top it all off, they face heavy consequences and penalties for inaccuracies.
With these challenges in mind, the goal of the platform was to streamline the reporting experience and to help reporters structure a narrative around data points, thus lifting the quality of their TCFD report and ultimately develop a consistent and industry-standard TCFD reporting template. Initially, the platform was to be developed the Japan market due to the mandatory TCFD reporting regulations it was bringing in for all corporates.
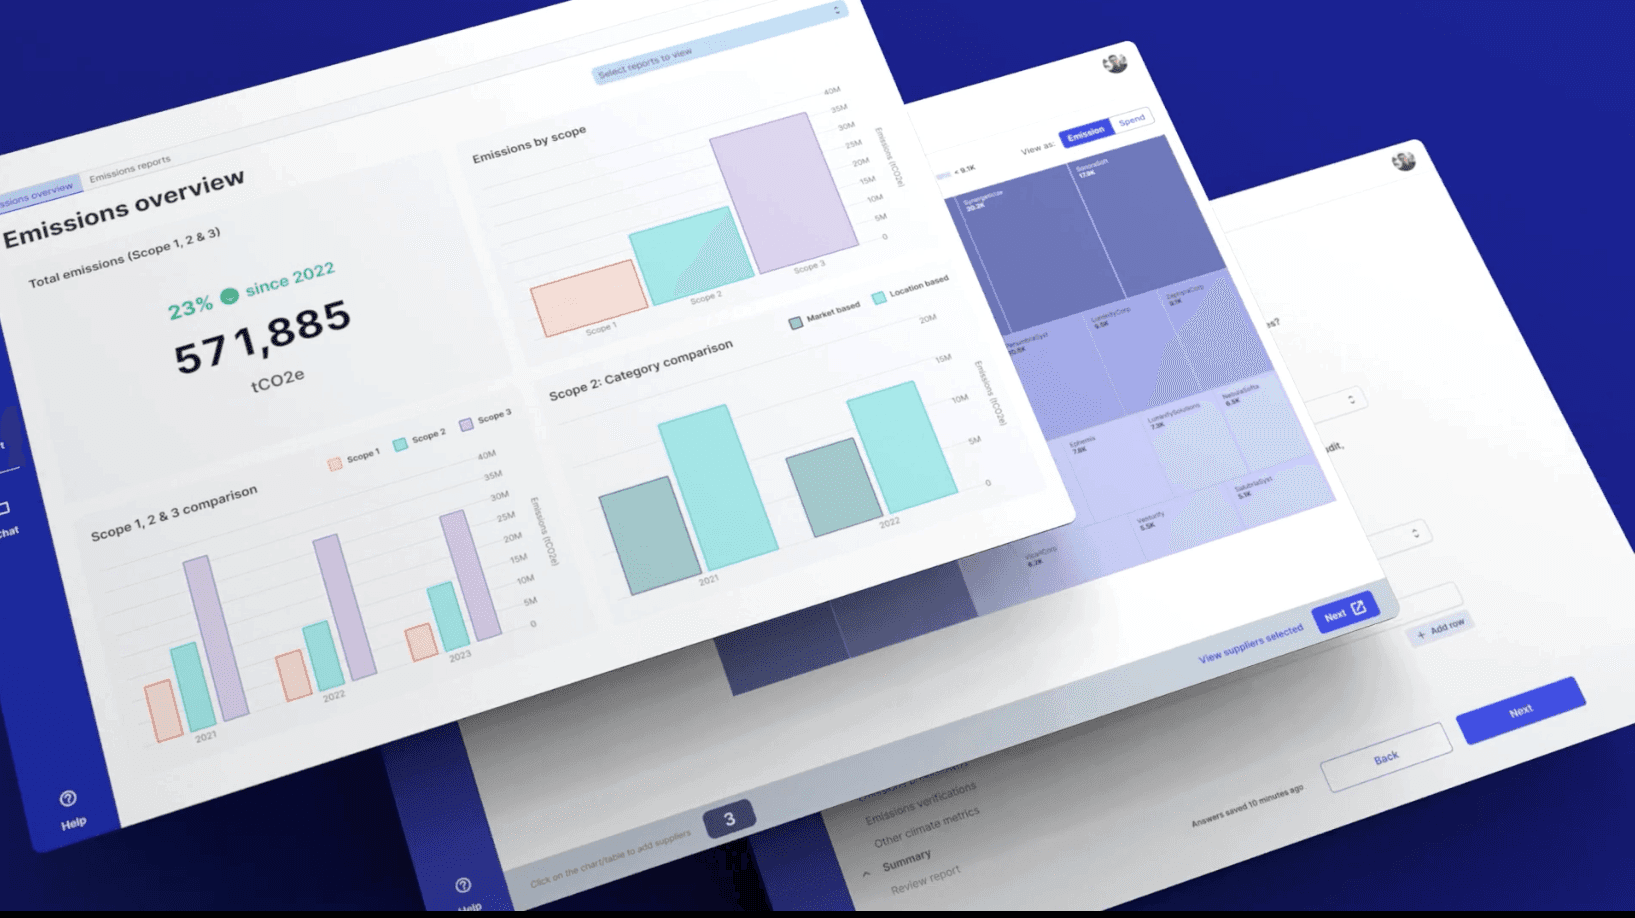
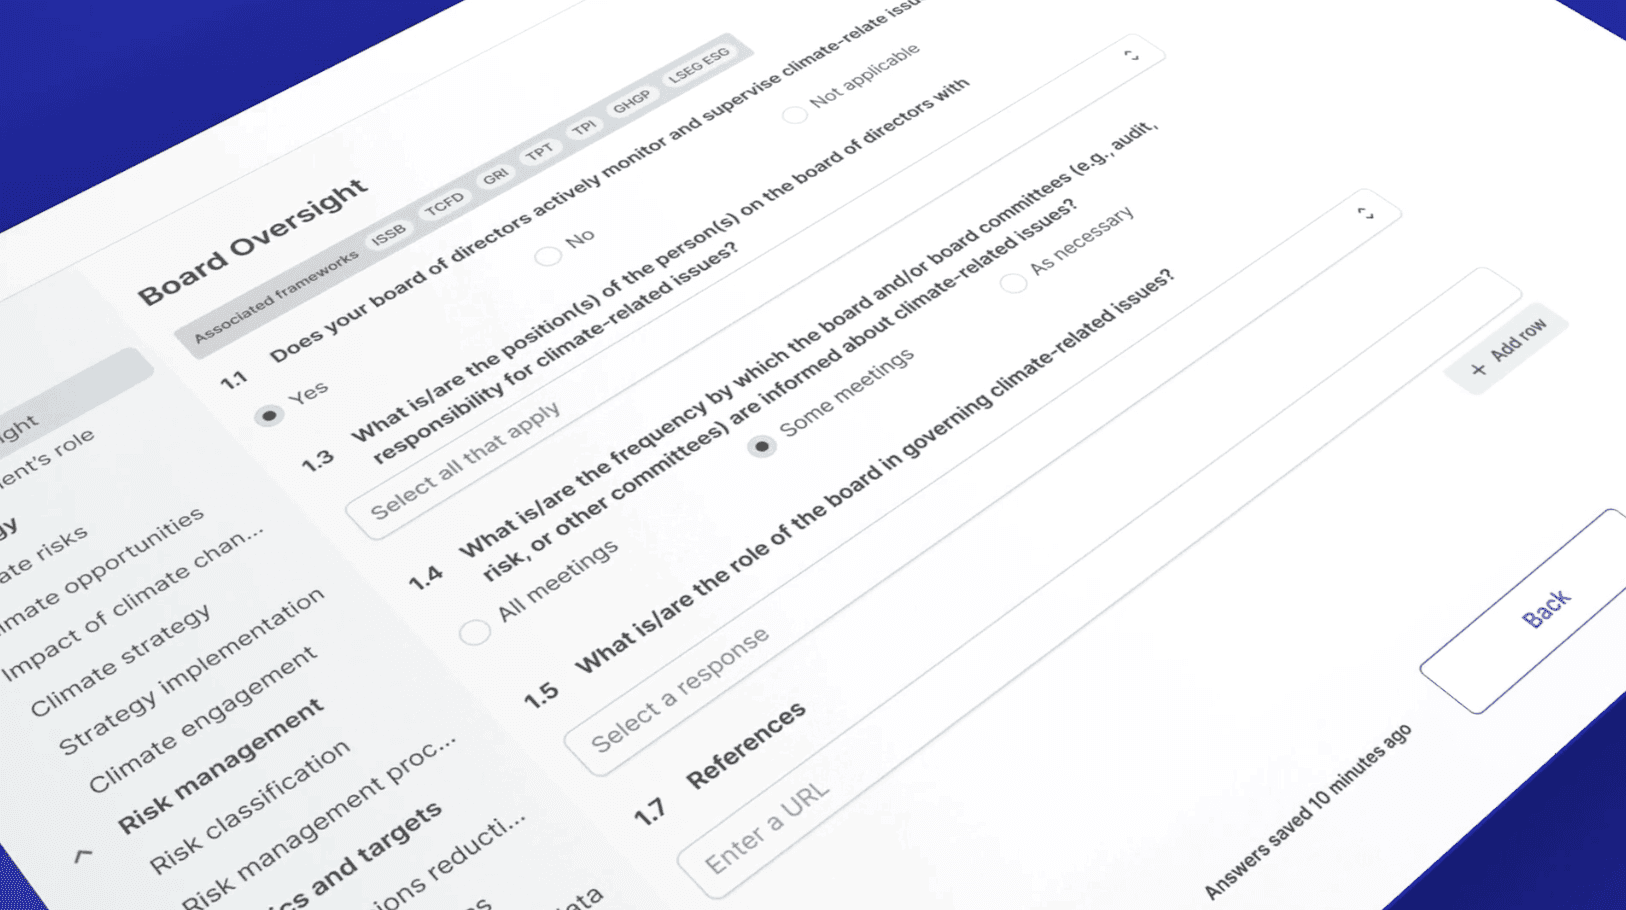
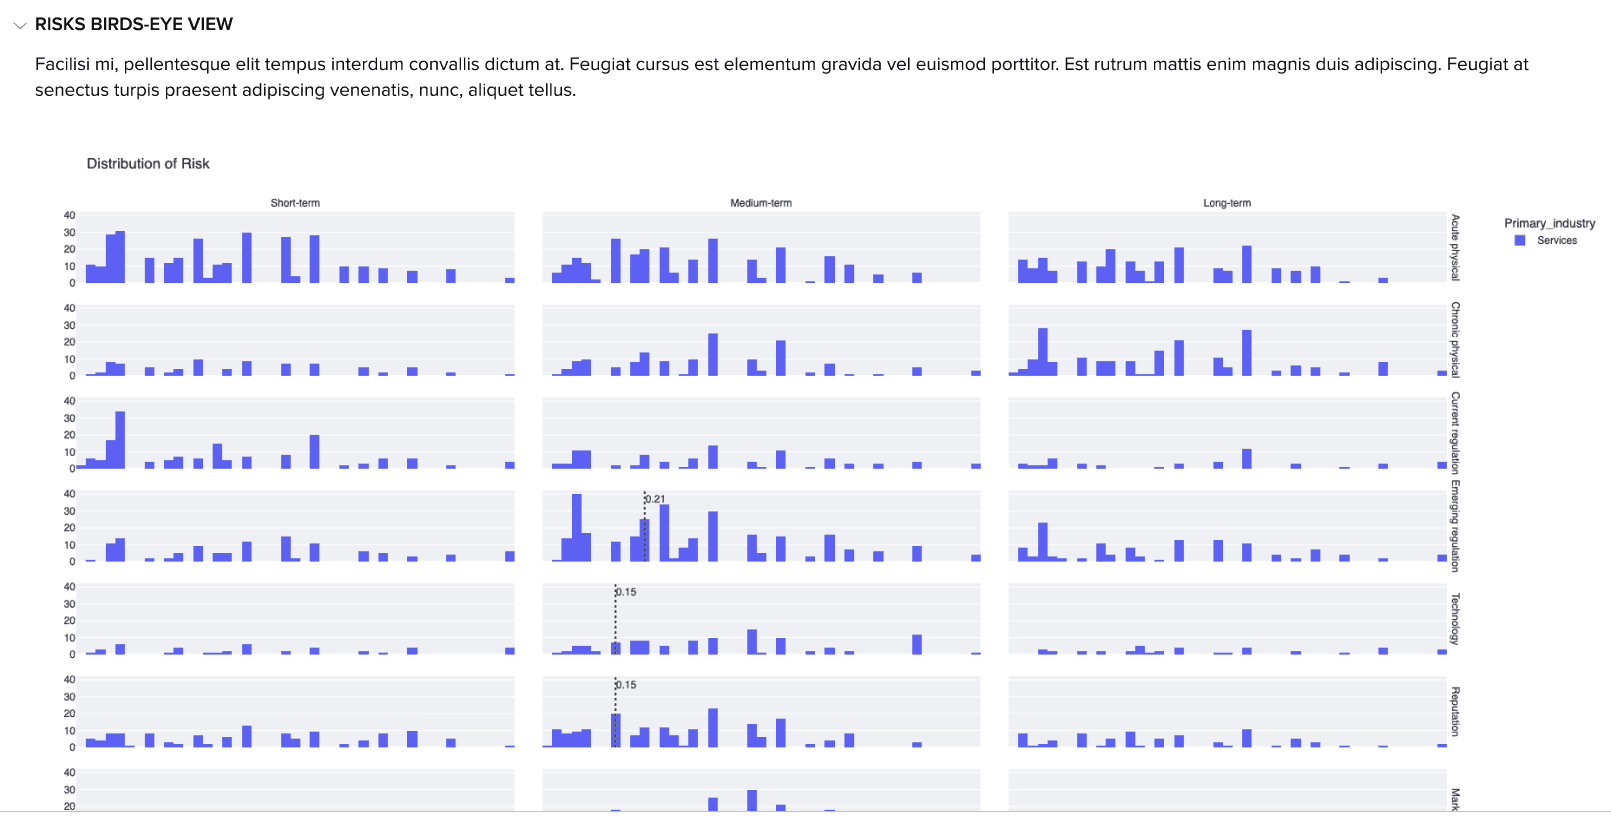
Examples of form design and data visualizations that required user validation
My approach in the Labs team
I refined the design hypotheses for the prototype and developed the strategy, plan, questions, and structure for user validation. We faced two challenges: the product team needed quick feedback to stay on schedule, but customer availability was limited due to the European summer season.To overcome this, I proposed validating with internal stakeholders focused on sustainability. This approach ensured alignment with industry knowledge and regulations while also gaining broader organizational support. The validation results guided key refinements in use cases and flows, with customer interviews scheduled as availability allowed. Insights from the customer research were promptly fed back into the highly cross-functional team, fostering close collaboration between data scientists, engineers, and product managers.
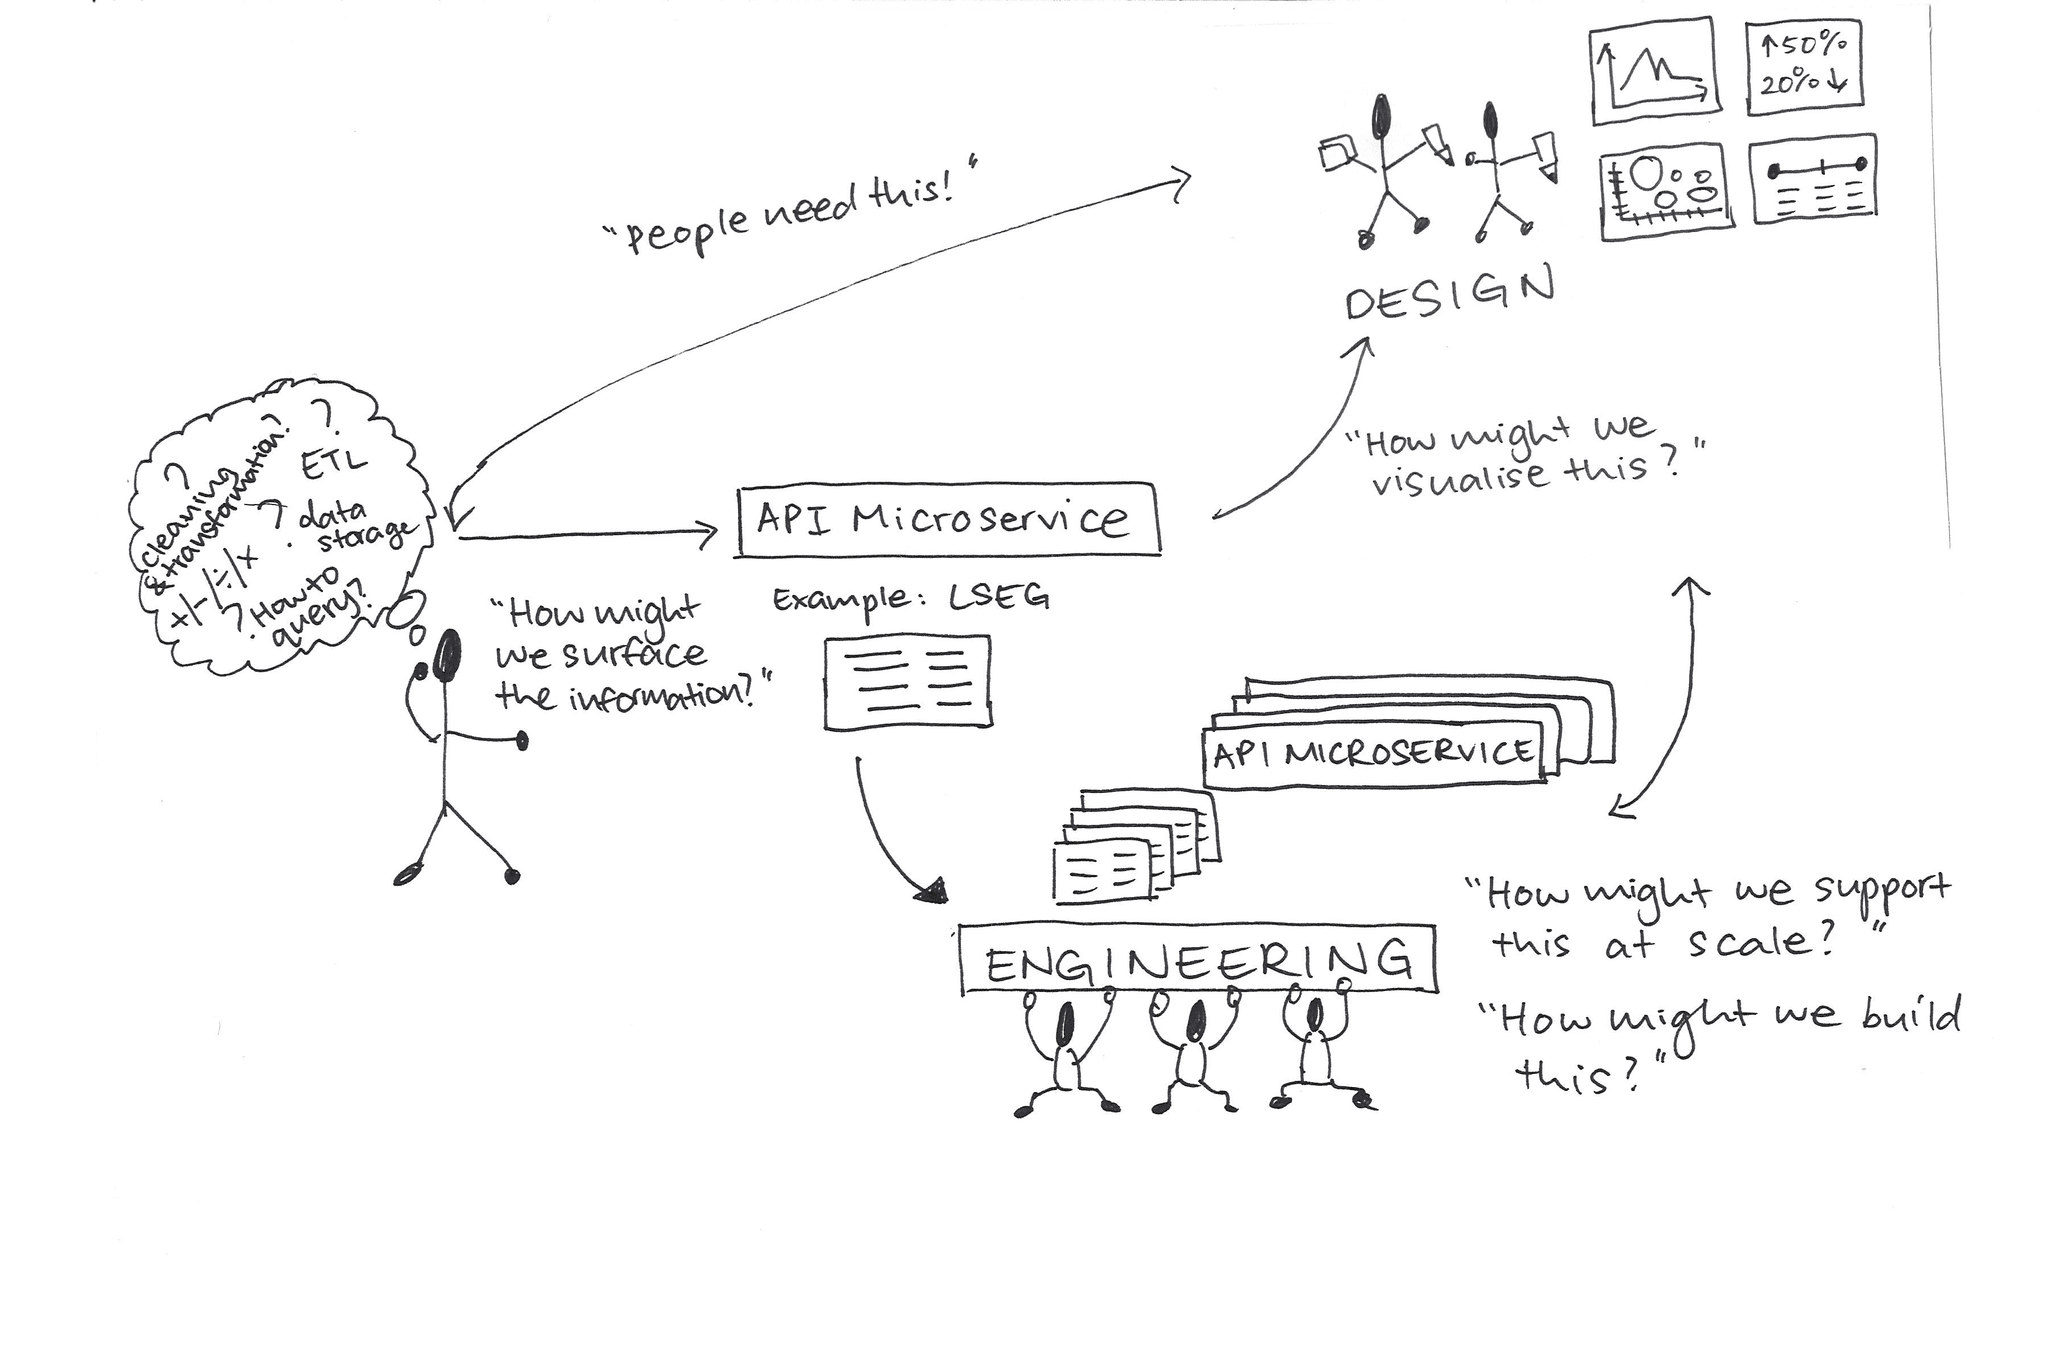
A sketchnote I created to illustrate in a company-wide broadcast on how the Labs cross-functional team innovate and work together
Validation, synthesis and insights
The user validation exercises were a mix of qualitative interviews and structured walkthroughs of the prototype, with users asked to provide their feedback as we walked through the screens. Participants ranged from customers to SMEs across Japan, Europe and the USA with titles including Sustainability Director to VP of Climate Change and Sustainability
All interviews were recorded and transcribed with participants’ consent. With the consent of participants, interview recordings and transcripts were securely stored in LSEG encrypted drives. Raw data from the interviews was extracted, synthesized and analyzed on Miro, where I could share the findings and insights directly with the Product team. Bottom up analysis of themes and sub-themes were generated from there, and presented back to the business and key sustainability stakeholders.
Outcome
Key research findings included:
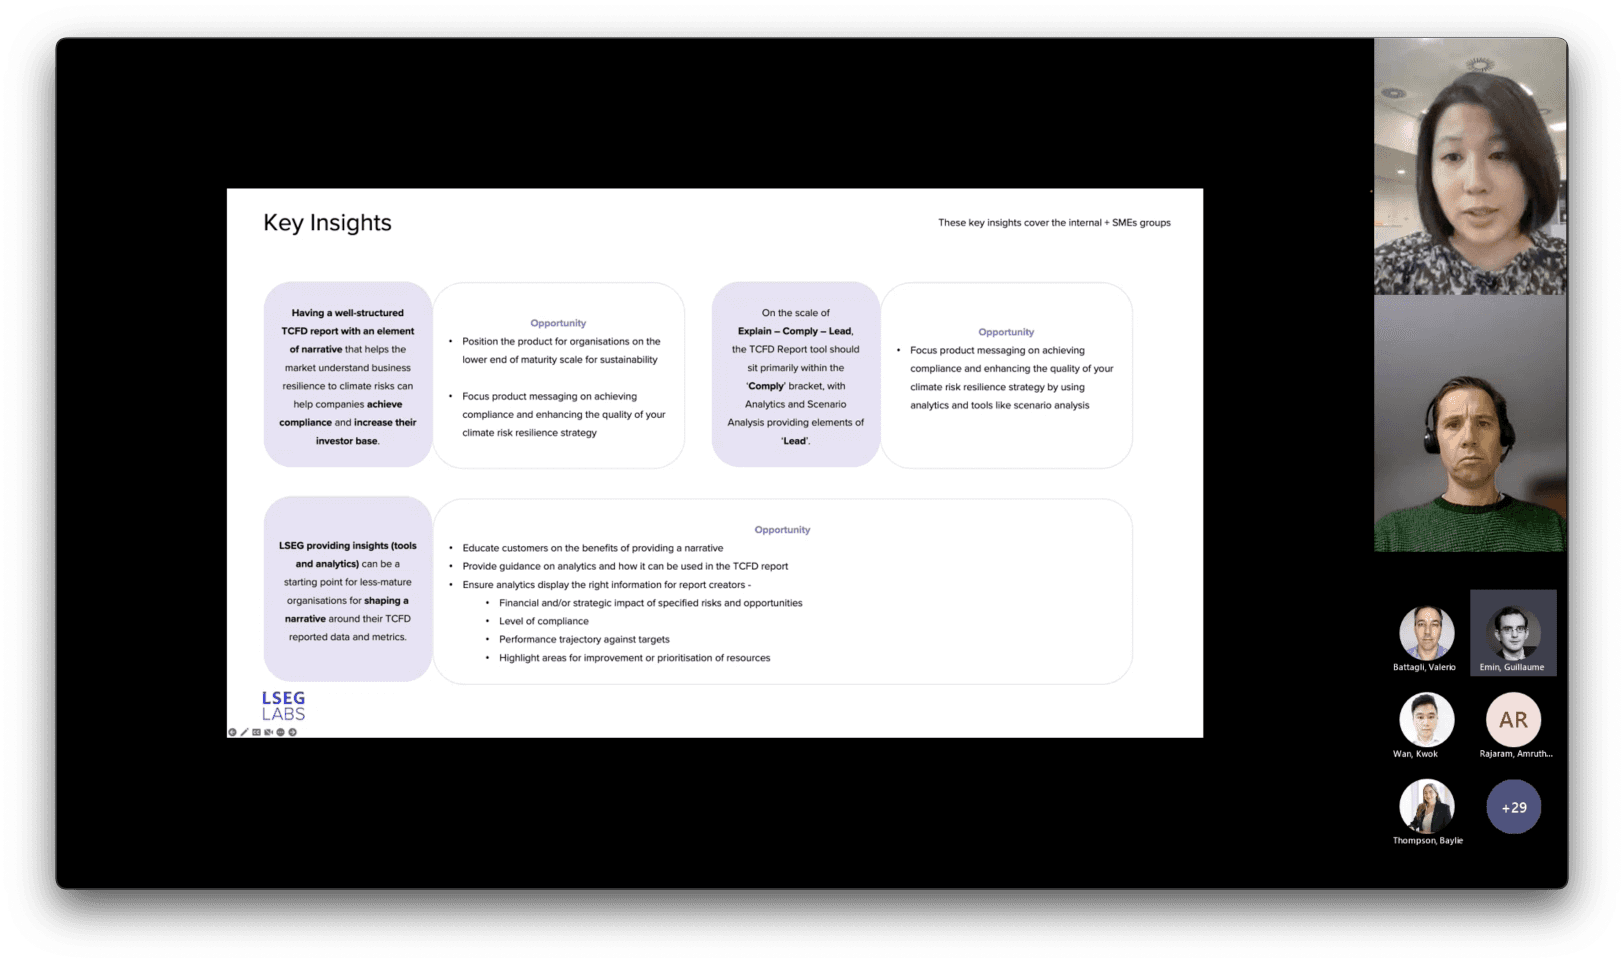
A strong narrative in a TCFD or sustainability report helps organizations achieve compliance and attract investors.
Companies can choose from three reporting approaches: "Explain," "Comply," or "Lead." The tool primarily supports "Comply" but can also offer elements of "Lead," like the Scenario Analysis tool for complex emission pathway calculations.
The tool is best suited for organizations with lower maturity in sustainability reporting, streamlining the process to ensure compliance.The prototype's data visualizations were more useful for strategic discussions at the board or investor level than for report creation.
Based on these findings, I collaborated with the data science team to develop new visualizations better suited for report creation, discussing potential new data points and themes like visualizing the financial impact of climate strategies. The insights also confirmed the business hypothesis that small to mid-sized companies would benefit from guidance on disclosing, compiling, and publishing sustainability data. We re-prioritized use cases to align with the report creator’s needs for the prototype's go-live version, which would be released to select LSEG corporate customers. I also organized a company-wide broadcast to share the user research insights, with over 30 sustainability-focused stakeholders attending.
Additional design activities
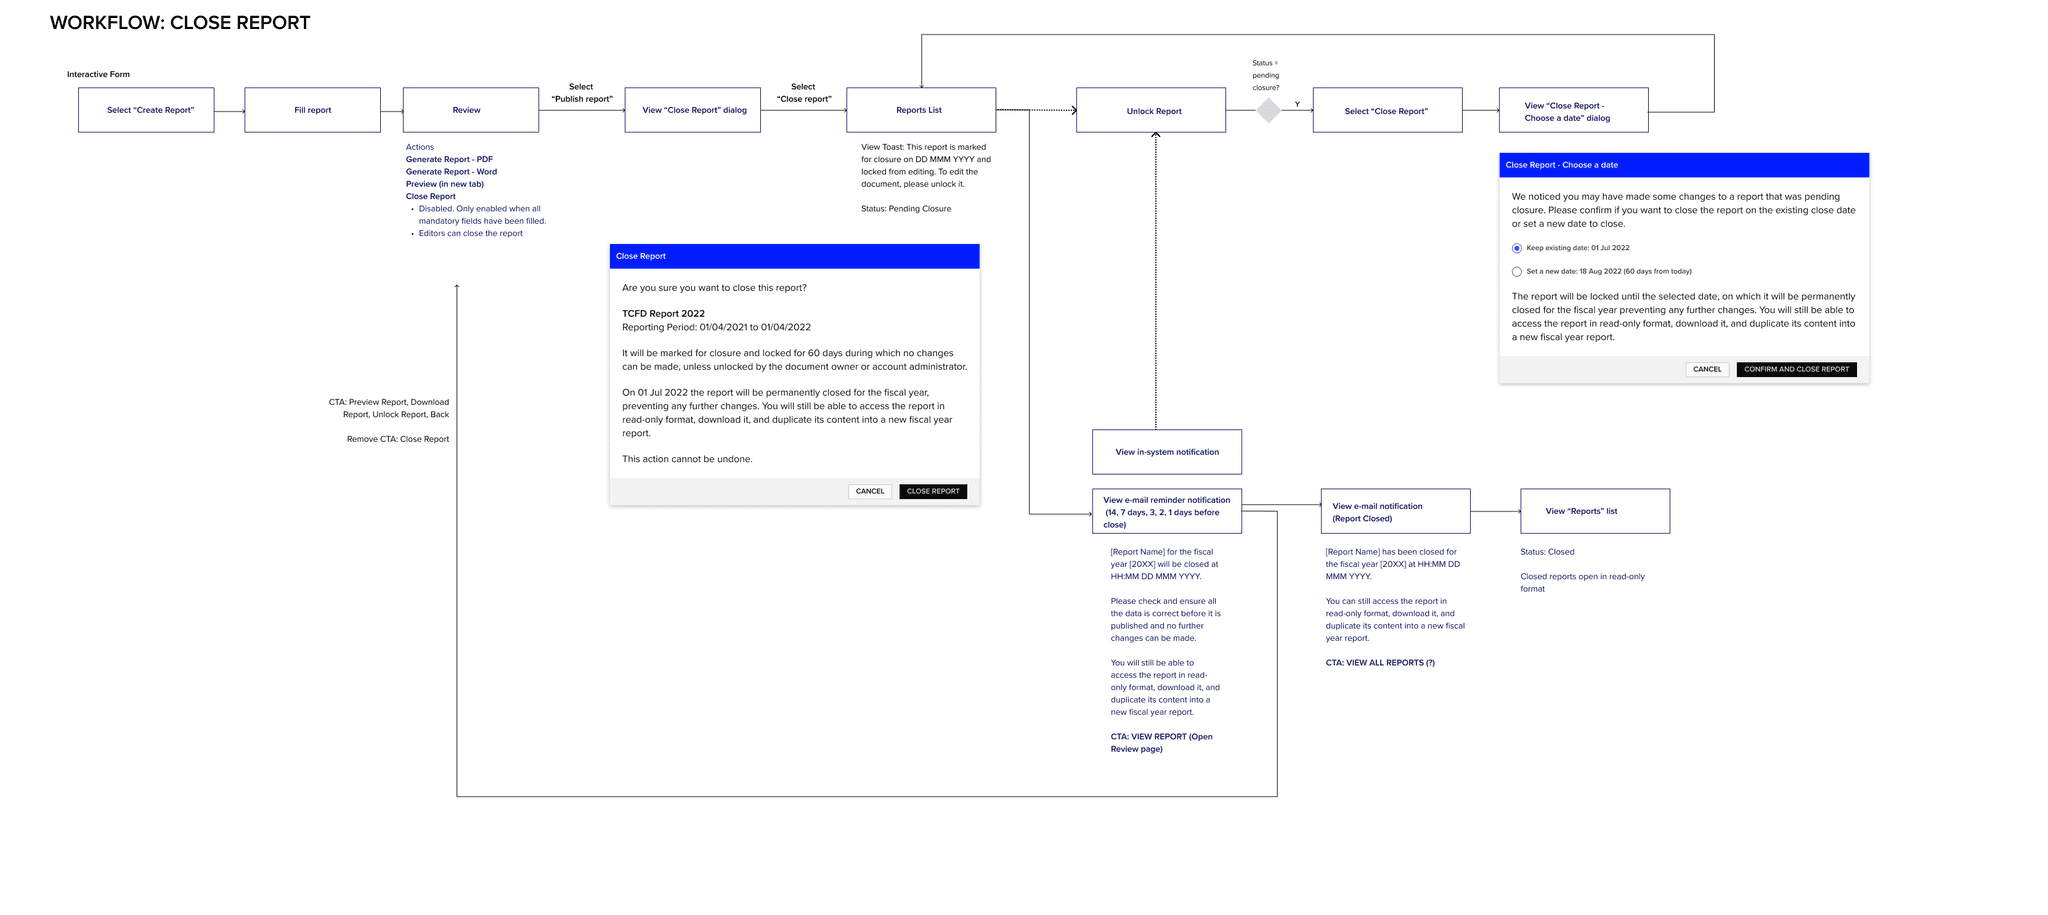
At LSEG Labs, I contributed to creating documentation and writing stories for the engineering team using Asana and Figma. My work involved handling complex interaction design stories that required understanding users' workflows and aligning them with platform security and data privacy needs. I also crafted microcopy for various interactions, including modal dialogs, email notifications, and toasts.
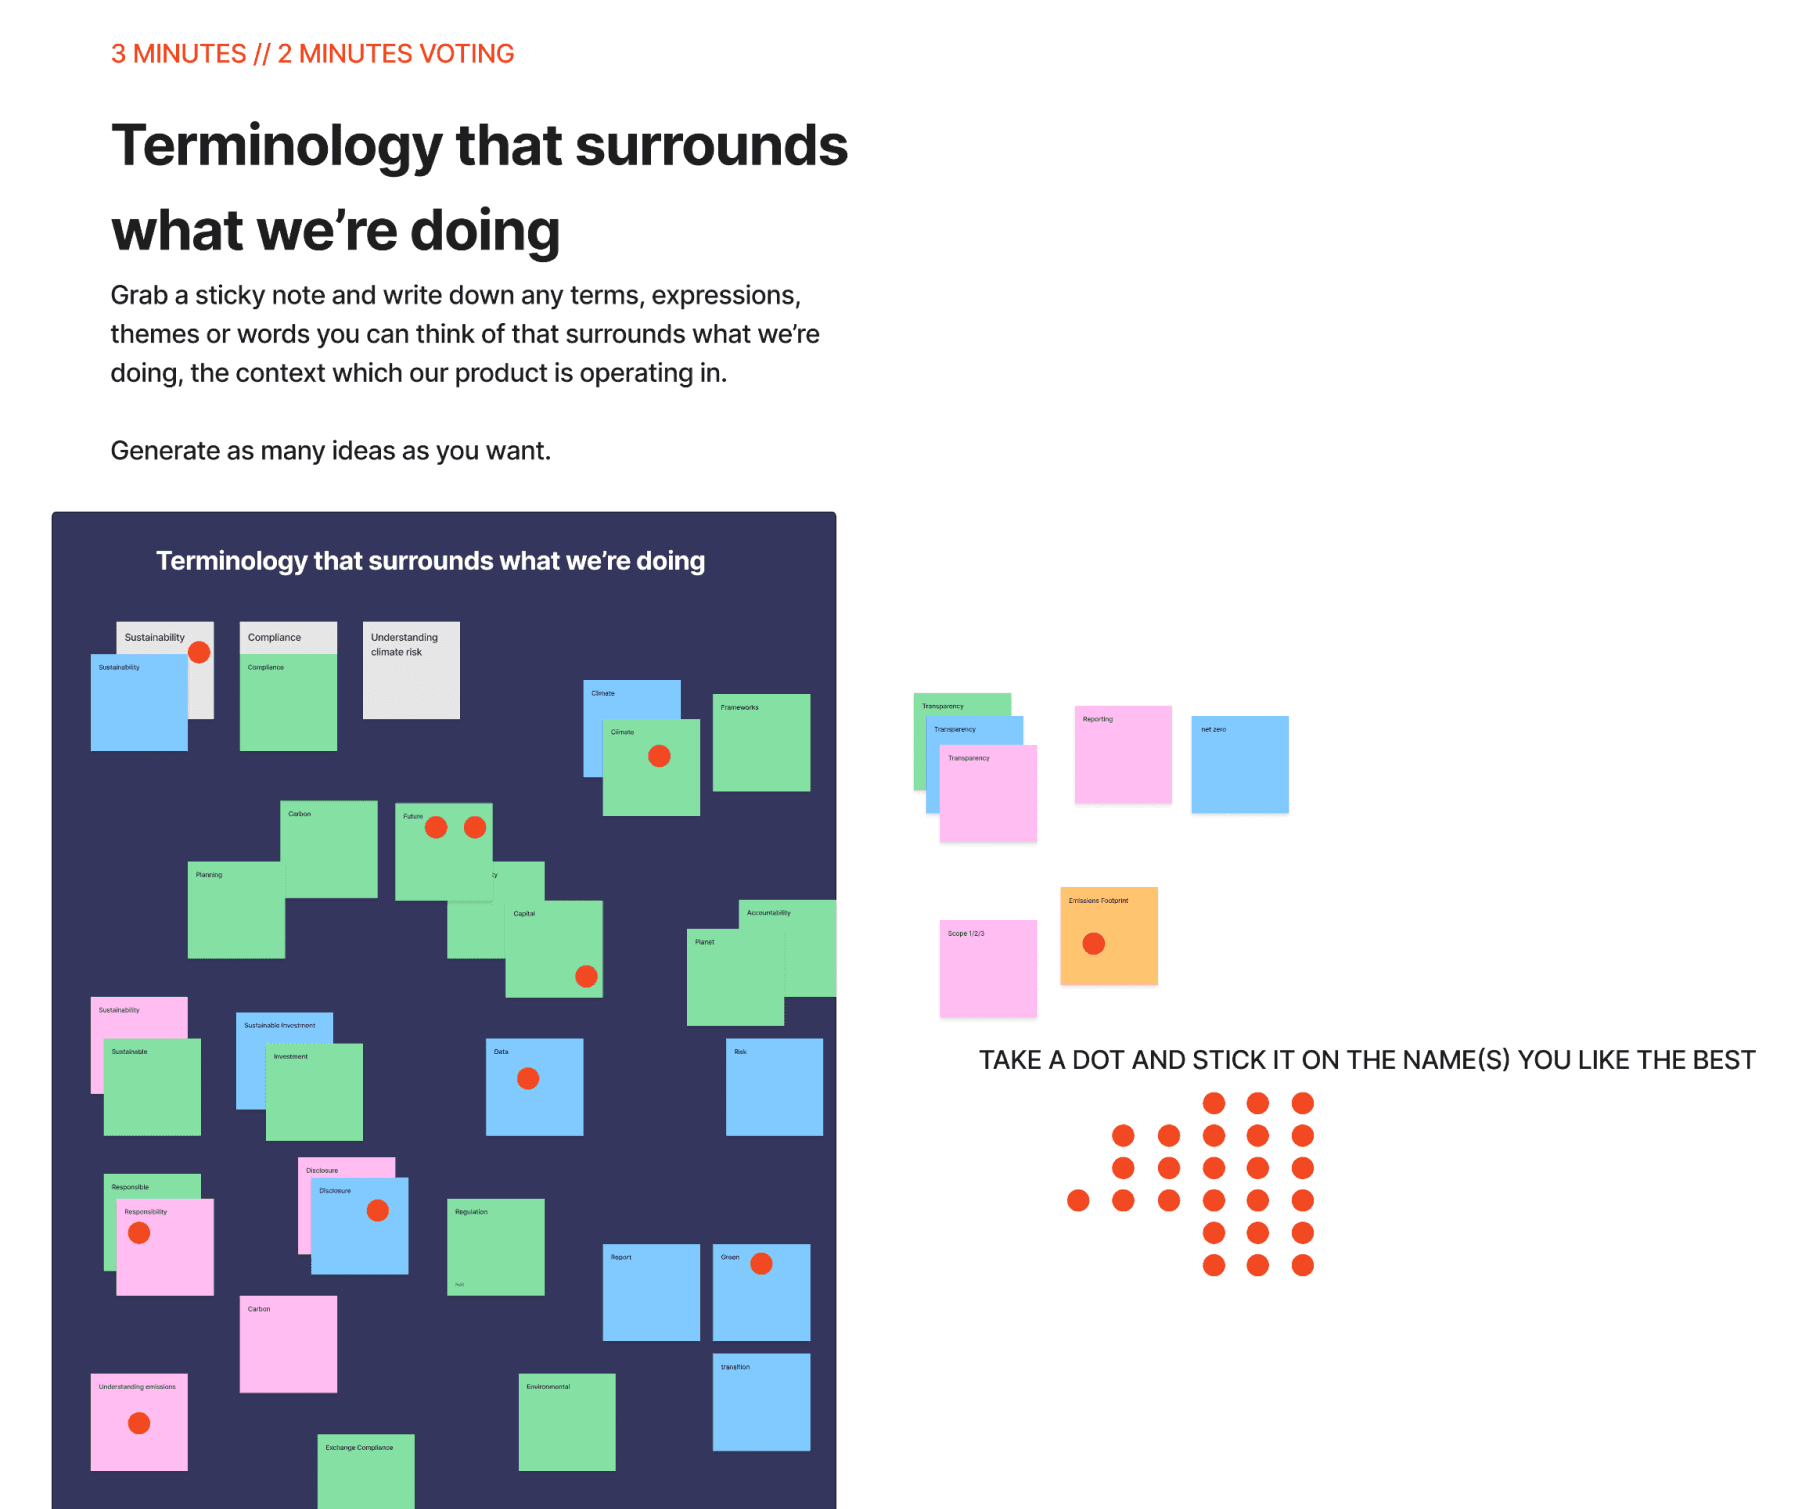
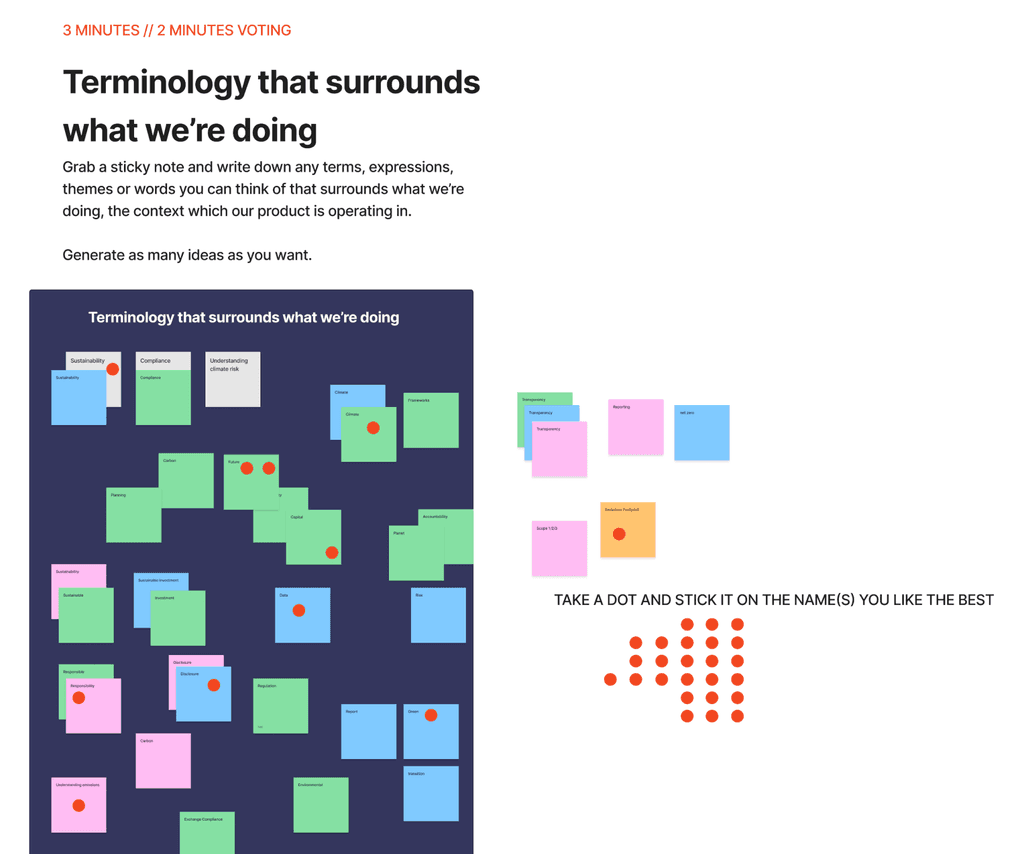
Additionally, I planned and conducted a product naming workshop with the product team and LSEG business stakeholders. Using Miro, I facilitated three sessions focused on idea generation and voting, which helped create a diverse set of potential names. The most popular options were presented to the Head of Brand, who selected the final name for the platform. These sessions fostered a sense of ownership and collective input among participants.
